


Cisco Nexus
A network dashboard is a single glass pane providing an overview of your network, showing you important information, configuration and policy enforcement, real-time alerts, and so on at a glance. This dashboard is composed of other several components: like; Resource counts. Network usage (current cycle) Network Utilization.
The dashboard can be distinct as an information management appliance that visually tracks, analyzes, and displays key performance indicators (KPI), metrics, as well as key data points, that provide benefits to monitor the current state of your network and components.
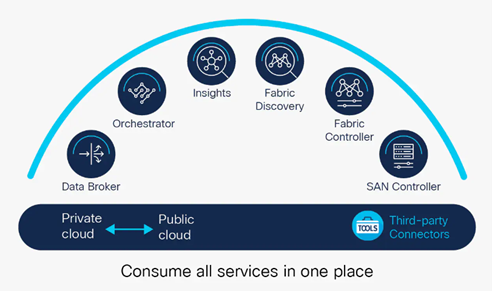
Cisco Nexus Dashboard is a single interface to monitor and scale across many sites, which includes:
- Cisco Application Centric Infrastructure fabric controllers
- Cisco® Application Policy Infrastructure Controller – APIC
- Cisco Nexus Dashboard Fabric Controller – NDFC
- Cloud APIC
- Third-party services
The Cisco Nexus Dashboard offers different deployment options:
- On-prem
- Hybrid
- Virtual
- Cloud
- SaaS
Our Experties
Maaz Technologies have several use cases where our professionals engaged with our esteemed customers to provide Nexus Dashboard Solution designing, and implementation support. The NDO solution works for ACI automation and Day-2 Operational support of data center analytics and reporting.
Subscribe to our newsletter
Maaz Technologies is an enterprise IT solutions provider serving local, regional and global customers with integrated enterprise solutions and services tailored to improve business performance.